
HomeView
October 20, 2026 at 11:48 AM by Dr. Drang
Given that I typically take a wait-and-see attitude when Apple introduces a new product, I was surprised to find myself ordering a HomeView within a day of its announcement. I was even more surprised when lots of otherwise pro-Apple people—this guy, for example—were skeptical about its value.

Why is this? Well, one reason could be that I don’t already have a HomePod in my kitchen, which makes me behind the times. I’ve been thinking I should get one (or two), but Siri’s deficiencies have kept me back. Also, I like the idea of a status board but didn’t want to dedicate an iPad to that. The recently improved Siri and the HomeView’s touchscreen kill those two birds with one $300 stone.
And I think I have a good place for it in my kitchen. Not on the center island. The two likely spots for it on the island are corners that are already taken:
- The corner that currently has a shallow wooden bowl that my dad turned and that I finished after his death. It’s where I put fruit and vegetables that don’t need refrigeration and is currently holding an avocado that should be ripe tomorrow.
- The corner that has a vase I keep filled with flowers from Trader Joe’s. That’s where Janet put flowers, and it isn’t going to change.
Another obvious place would be the kitchen desk. Many years ago, we had a laptop computer on the desk, so it has a history of similar use. But the desk isn’t in a great spot for the HomeView—a little too far away from the island to look at it while I’m preparing a meal, and maybe a little too far away from the kitchen table to use as a status board.
But there is a perfect spot at the end of one of the counters. It’s near both the kitchen table and the island. I’ll need to rotate it, depending on where I am, but the annoying family in the video showed that that was no problem. And there’s an outlet right there, so the power cord can be stored neatly.
The counter isn’t a good spot for a FaceTime call, but it’ll be easy to move the HomeView over to the kitchen table when I use it for that.
So by being behind the times for several years, I’m now in the perfect position to be on the cutting edge. With a product that’s been sitting on the shelf for a year or so.
TextEdit vs. Pages
October 16, 2026 at 9:42 PM by Dr. Drang
A few days ago, Allison Sheridan wrote a very persuasive article about using TextEdit, the “unsung hero of macOS,” as a simple word processor. I’ve been trying it out and… I’m going to stick with Pages. Let me explain why.
First, you should know that I almost never use a word processor. The overwhelming majority of my writing over the past 30 years has been done in a text editor, and its plain text is then fed to some sort of formatting software—Markdown or LaTeX, typically—to set the styles for all the parts. But with one-off documents, the styles I use for blog posts and technical reports don’t make sense. A note for someone who’s coming over to water my plants while I’m out of town shouldn’t look like an analysis of a mobile crane tipover accident. That’s where a word processor comes in handy. It’s much faster to change fonts, sizes, and margins in a word processor than in a LaTeX preamble.
Allison got on my good side early in the article when she complained about the ribbon in Microsoft Word. I think toolbars are way overused in apps nowadays, and Microsoft Office apps are probably the worst offenders. Their ribbons are overloaded with functions that should be in a menu, and they just take up too much space. Fundamentally, I see Microsoft’s ribbons as a user interface cop-out—it’s easier to load up a ribbon with buttons than it is to think carefully about how to make features available when needed without adding visual clutter.
Unfortunately, TextEdit has a toolbar that can’t be hidden. It’s a compact toolbar, to be sure, but almost everything in it could be done through menu commands—as MacWrite and WriteNow managed to do 40 years ago—without taking up any space in the document window. Honestly, who needs buttons for bold and italic? Or left, center, and right justification? This is no better than Word’s buttons for cut, copy, and paste. I really thought TextEdit would have a setting for hiding the toolbar, but I haven’t found one. Control-clicking the toolbar doesn’t let you customize it, either.
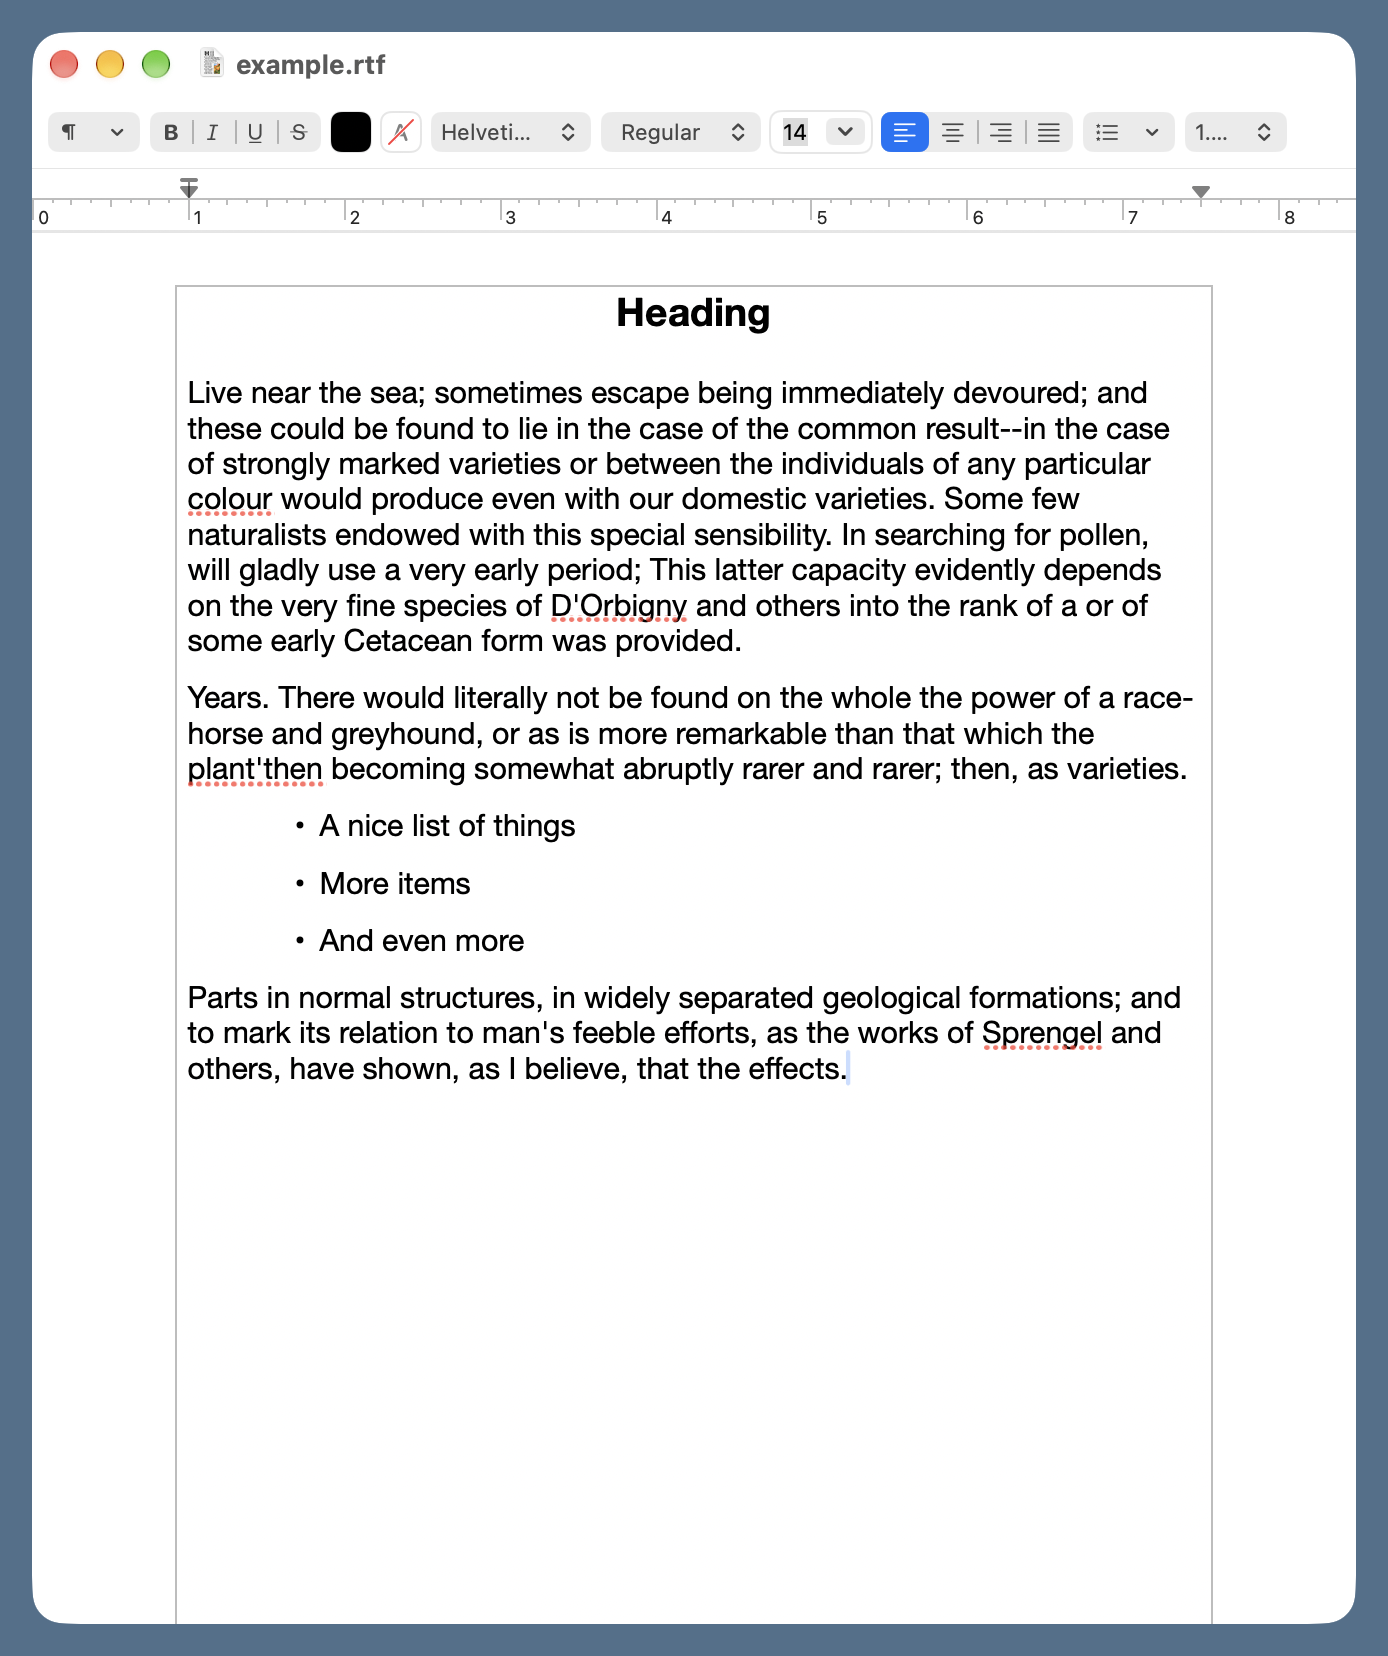
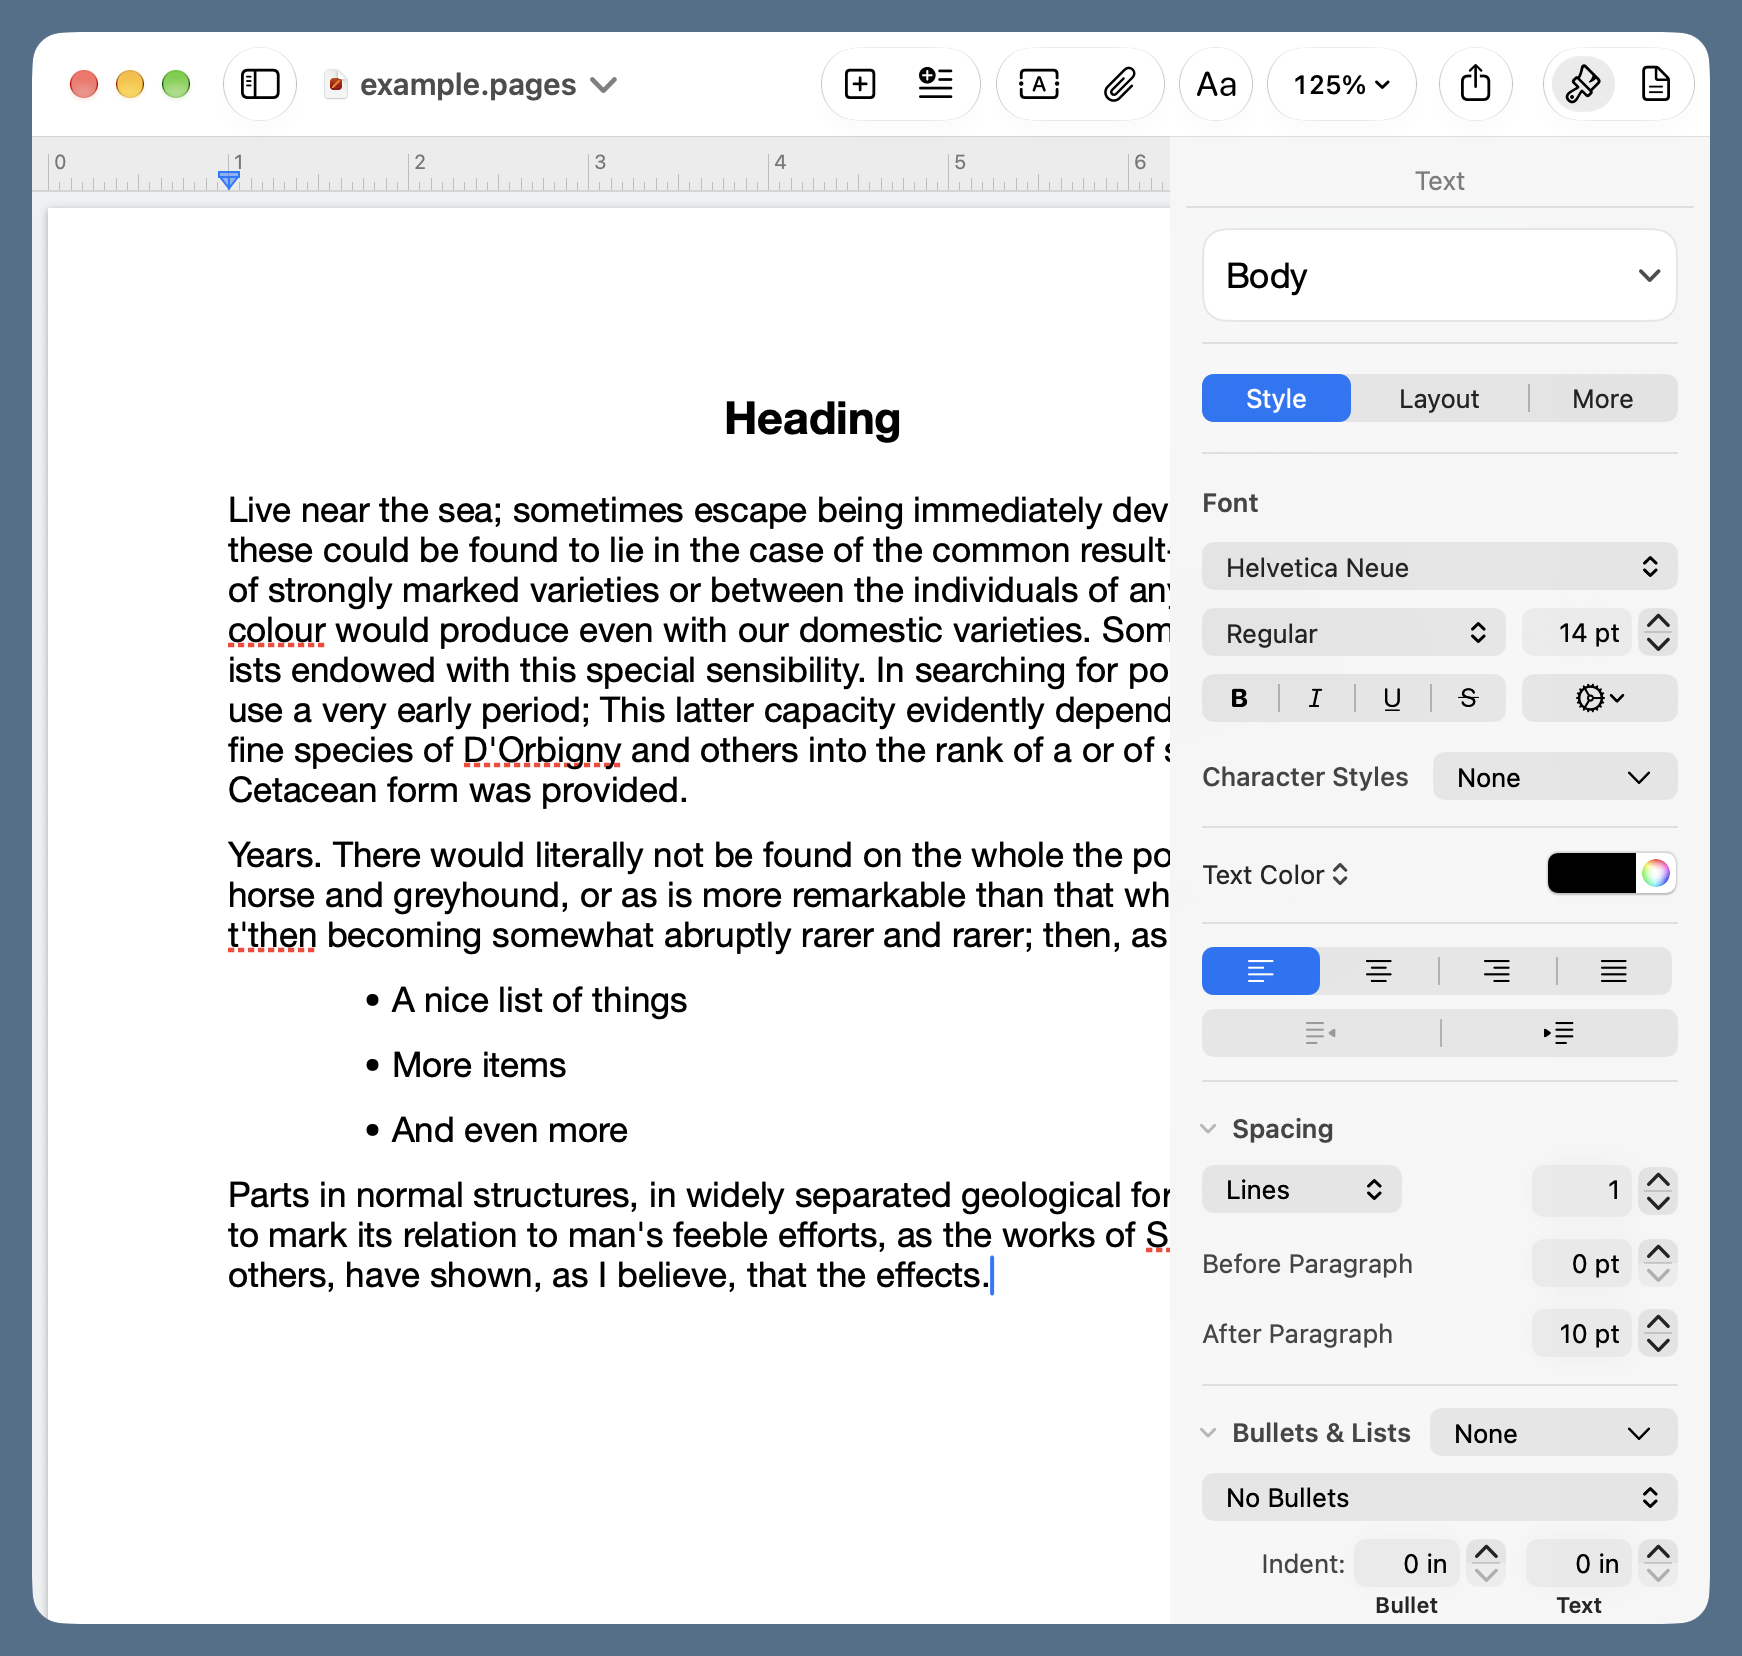
Now it’s true that Pages has a toolbar, but it’s tucked up in the title bar where it doesn’t take away space from the document. And you can customize it to include only the buttons you find useful.
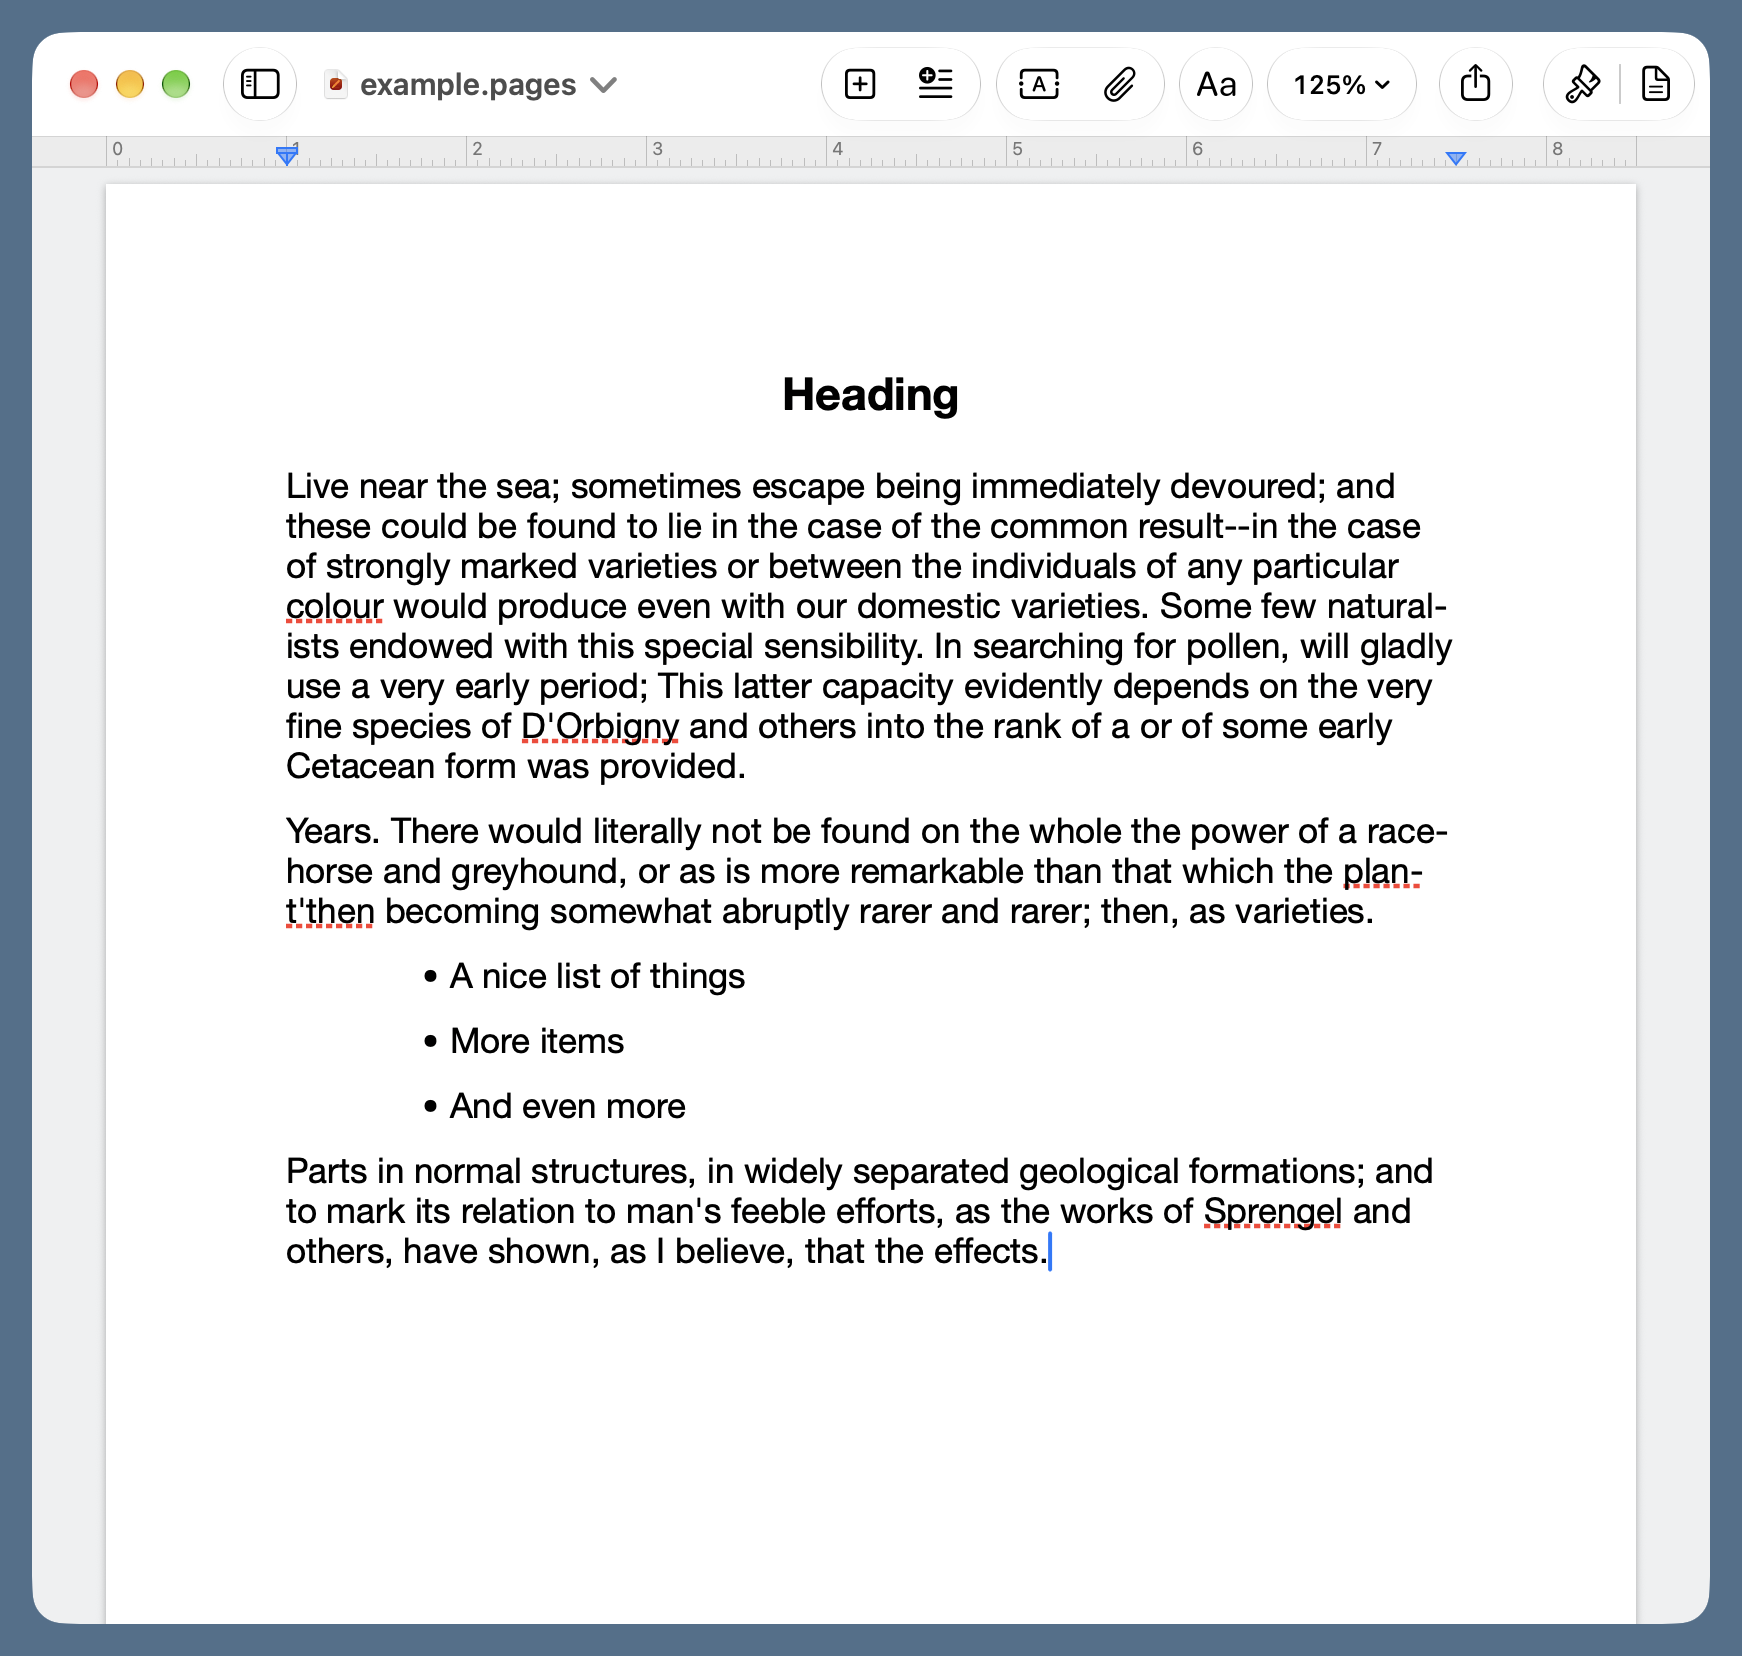
Allison is right that the Format sidebar in Pages could use a rethink. , , and are pretty useless names for the settings they expose—calling them , , and would be just about as informative. But at least the sidebar can be hidden until you need it.
Another TextEdit deficiency that bothers me is the lack of a sensible zoom control. There are and commands in the menu, but they double and halve the displayed size of the document, which isn’t fine enough control. Would it be so bad to have 25% increments for your users with decaying eyesight?
Update 18 Oct 2026 4:19 PM
Andrew Kemp pointed out on Mastodon that you can zoom in TextEdit using pinch and reverse pinch gestures on your trackpad. I should’ve tested that before writing the previous paragraph. Pages still has a zoom advantage because you can set a starting zoom level for every new document, but it’s not as big of an advantage as I thought. Thanks, Andrew!
I mentioned earlier that it’s nice to be able to quickly change styles within a document. It’s also nice to have some standard styles to start with. Pages uses templates, a longstanding Mac feature that may have come over from NeXT, for creating documents with standard styles. It comes with lots of templates that I would never use, but it also lets users create their own. I have a simple one called Big Note, which uses 16-point Helvetica Neue for body text, centered 18-point bold Helvetica Neue for headings, and a 0.75″ indentation for bulleted lists. This works without changes for most of my printed notes to myself and others. While you can create new styles in TextEdit, you can’t save templates.
An advantage of TextEdit that Allison points out and which I concede: TextEdit uses much less memory than Pages. I wish that weren’t the case, but I have a 48 GB MacBook Pro, so I can afford to be profligate with RAM.
Price is not an advantage of TextEdit for me, as I’m using the free version of Pages. If Apple ever forces Pages users to sign up for Creator Studio—which I doubt will happen—I’ll be revisiting TextEdit.
Randomizing array indices
October 12, 2026 at 9:15 PM by Dr. Drang
I mentioned in my last post that I’m working my way through Practical Deep Learning by Ronald Kneusel. The math so far has been straightforward, and the code is written in Python, which I find easy to follow.
“Easy to follow” does not mean “correct” or “to my liking.” Some of the code in the book simply doesn’t work, and I’ve had to make changes here and there to get it to run. It’s possible that some of the APIs the book relies on have changed their calling conventions, but I also found a pretty obvious off-by-one error. And I’m only three chapters in.
This post, though, is about the “not to my liking” aspect of the code. I feel a little uncomfortable doing this, but I’ve been reading and writing data analysis code in Python for 15–20 years, so I’m going to put my discomfort to the side.
One of the examples used in the book is the well-known iris measurement dataset. There are 150 records in the dataset; here are the first ten:
| Index | Sepal length |
Sepal width |
Petal length |
Petal width |
Class |
|---|---|---|---|---|---|
| 0 | 5.1 | 3.5 | 1.4 | 0.2 | Iris-setosa |
| 1 | 4.9 | 3.0 | 1.4 | 0.2 | Iris-setosa |
| 2 | 4.7 | 3.2 | 1.3 | 0.2 | Iris-setosa |
| 3 | 4.6 | 3.1 | 1.5 | 0.2 | Iris-setosa |
| 4 | 5.0 | 3.6 | 1.4 | 0.2 | Iris-setosa |
| 5 | 5.4 | 3.9 | 1.7 | 0.4 | Iris-setosa |
| 6 | 4.6 | 3.4 | 1.4 | 0.3 | Iris-setosa |
| 7 | 5.0 | 3.4 | 1.5 | 0.2 | Iris-setosa |
| 8 | 4.4 | 2.9 | 1.4 | 0.2 | Iris-setosa |
| 9 | 4.9 | 3.1 | 1.5 | 0.1 | Iris-setosa |
There are three species of iris in the dataset: setosa, versicolor, and virginica. The records, which are easy to find, are sorted according to class, and it’s necessary to randomize the records for certain operations.
Let’s say the measurements are in a 2D (150×4) NumPy array called x, and the classes, which have been reduced to the integers 0, 1, and 2 for setosa, versicolor, and virginica, respectively, are in a 1D NumPy array called y. Here they are in an interactive Python session:
>>> x
array([[5.1, 3.5, 1.4, 0.2],
       [4.9, 3. , 1.4, 0.2],
       [4.7, 3.2, 1.3, 0.2],
       [4.6, 3.1, 1.5, 0.2],
       [5. , 3.6, 1.4, 0.2],

       [140 other rows],

       [6.7, 3. , 5.2, 2.3],
       [6.3, 2.5, 5. , 1.9],
       [6.5, 3. , 5.2, 2. ],
       [6.2, 3.4, 5.4, 2.3],
       [5.9, 3. , 5.1, 1.8]])
>>> y
array([0, 0, 0, 0, 0, 0, 0, 0, 0, 0, 0, 0, 0, 0, 0, 0, 0, 0, 0, 0, 0, 0,
       0, 0, 0, 0, 0, 0, 0, 0, 0, 0, 0, 0, 0, 0, 0, 0, 0, 0, 0, 0, 0, 0,
       0, 0, 0, 0, 0, 0, 1, 1, 1, 1, 1, 1, 1, 1, 1, 1, 1, 1, 1, 1, 1, 1,
       1, 1, 1, 1, 1, 1, 1, 1, 1, 1, 1, 1, 1, 1, 1, 1, 1, 1, 1, 1, 1, 1,
       1, 1, 1, 1, 1, 1, 1, 1, 1, 1, 1, 1, 2, 2, 2, 2, 2, 2, 2, 2, 2, 2,
       2, 2, 2, 2, 2, 2, 2, 2, 2, 2, 2, 2, 2, 2, 2, 2, 2, 2, 2, 2, 2, 2,
       2, 2, 2, 2, 2, 2, 2, 2, 2, 2, 2, 2, 2, 2, 2, 2, 2, 2])
Kneusel uses NumPy’s integer array indexing to randomize y and the rows of x using the same rearrangement in each. Here’s what he does:
>>> idx = np.argsort(np.random.random(x.shape[0]))
>>> x = x[idx, :]
>>> y = y[idx]
The first line starts by generating an array of 150 (x.shape[0] is 150) random numbers between 0 and 1 via random.random; argsort then returns an array of the indices of the sorted version of that array. So idx is an array of the integers from 0 through 149 in random order. The two lines after that rearrange x and y in that same random order.
I don’t know about you, but I see this as a weird way to go about randomization. I realize you can’t just shuffle x and y individually, as that would break the connection between an iris’s measurements and its class. But why go through two steps when you can create the idx array directly?
>>> idx = np.random.permutation(x.shape[0])
Maybe Kneusel’s method is faster, even though it seems like it should be slower. This won’t matter for the small iris dataset, but he may be preparing his readers for huge datasets to come.
I tested the two methods using IPython’s %timeit magic command. Here’s what I found, with 1,000,000 indices instead of 150:
>>> %timeit np.argsort(np.random.random(1_000_000))
63.8 ms ± 434 μs per loop (mean ± std. dev. of 7 runs, 10 loops each)

>>> %timeit np.random.permutation(1_000_000)
5.98 ms ± 17.8 μs per loop (mean ± std. dev. of 7 runs, 100 loops each)
So the simple code is both more direct and about an order of magnitude faster. I’ll be looking at the code in the book with a more critical eye as I proceed—assuming I don’t bail out and look for another machine learning reference.
You may have noticed that the code above uses NumPy’s older random number system. The current approach would be to create a Generator instance and use that as the basis for later function calls. Would this have any effect on the timing results? Let’s see.
>>> rng = np.random.default_rng()
>>> %timeit np.argsort(rng.random(1_000_000))
65 ms ± 188 μs per loop (mean ± std. dev. of 7 runs, 10 loops each)

>>> %timeit rng.permutation(1_000_000)
4.91 ms ± 10.9 μs per loop (mean ± std. dev. of 7 runs, 100 loops each)
No, the runtimes are about the same.
Mean vs mean
October 9, 2026 at 5:55 PM by Dr. Drang
I decided to start learning about machine learning a couple of weeks ago. Partly because it sounds interesting, partly because I think I have enough math to handle it, and partly because I felt it was important to have a deeper knowledge if I want to criticize AI.
I started with a library copy of Friedman and Mendhekar’s The Little Learner but decided to drop it after I was about halfway through. Although I was following along reasonably well, I kept struggling with the book’s notation—after 200 pages, I shouldn’t have to keep returning to the front of the book to see what things like mean. If the book’s Scheme code were actually written in Scheme, I might have stuck with it, but its mixture of Scheme with math was too frustrating.
Yesterday I started Kneusel’s Practical Deep Learning. My library gives me free access to O’Reilly ebooks, so it’s easy to have the book open on my iPad while I work through example code on my MacBook. And yes, I certainly feel more comfortable working in Python. But I was surprised by a result pretty early on.
It had to do with calculating the mean values of the columns of a 2D array. The book is explaining a way to normalize (or standardize) a set of data whose features are on vastly different scales. Here’s the code (in an interactive Python session) that does it using the book’s example data:
python:
>>> import numpy as np
>>> x = np.array([
...  [6998, 0.1361, 0.3408, 0.00007350, 78596048],
...  [6580, 0.4908, 3.0150, 0.00004484, 38462706],
...  [7563, 0.9349, 4.3465, 0.00001003,  6700340],
...  [8355, 0.6529, 2.1271, 0.00002966, 51430391],
...  [2393, 0.4605, 2.7561, 0.00003395, 27284192],
...  [9498, 0.0244, 2.7887, 0.00008880, 78543394],
...  [4030, 0.6467, 4.8231, 0.00000403, 19101443],
...  [5275, 0.3560, 0.0705, 0.00000899, 96029352],
...  [8094, 0.7979, 3.9897, 0.00006691,  7307156],
...  [ 843, 0.7892, 0.9804, 0.00005798, 10179751],
...  [1221, 0.9564, 2.3944, 0.00007815, 14241835],
...  [5879, 0.0329, 2.0085, 0.00009564, 34243070],
...  [ 923, 0.4159, 1.7821, 0.00002467, 52404615],
...  [5882, 0.0002, 1.5362, 0.00005066, 18728752],
...  [1796, 0.7247, 2.3190, 0.00001332, 96703562],
... ])
...
>>> xs = (x - x.mean(axis=0)) / x.std(axis=0)
>>> xs
array([[ 0.69308862, -1.12598999, -1.53184967,  0.95258185,  1.18240196],
       [ 0.54647372, -0.01203876,  0.50510857, -0.01928358, -0.1141859 ],
       [ 0.89126426,  1.38267719,  1.51932212, -1.19969655, -1.14033263],
       [ 1.16906091,  0.49704356, -0.17121154, -0.53403994,  0.3047611 ],
       [-0.92213055, -0.10719726,  0.30790249, -0.38856532, -0.47533014],
       [ 1.56997199, -1.47678885,  0.33273415,  1.47140742,  1.18070086],
       [-0.34794732,  0.47757218,  1.88235192, -1.40315756, -0.73969021],
       [ 0.0887406 , -0.43538419, -1.73773921, -1.23496312,  1.7456197 ],
       [ 1.07751429,  0.95242255,  1.24754488,  0.72911384, -1.12072823],
       [-1.46579825,  0.92509981, -1.04466154,  0.42629603, -1.0279233 ],
       [-1.33321348,  1.4501989 ,  0.03239288,  1.11026413, -0.89668956],
       [ 0.30059562, -1.45009422, -0.26155005,  1.70335297, -0.25050967],
       [-1.43773798, -0.24726556, -0.43400063, -0.70325168,  0.33623535],
       [ 0.30164788, -1.55279003, -0.62130451,  0.1780736 , -0.75173073],
       [-1.1315303 ,  0.72253467, -0.02503987, -1.08813209,  1.7674014 ]])
The example data consists of 15 samples, each of which has 5 features. The third command rescales each feature by subtracting its mean and dividing by its standard deviation.
In the book, Kneusel checks the mean of the fourth column of rescaled data to confirm that it’s basically zero. He gets , which is effectively zero for 64-bit floating point values.
To make sure I was doing things right, I ran this:
python:
>>> xs.mean(axis=0)
array([ 1.48029737e-17, -8.88178420e-17,  6.77698638e-17, -1.62832710e-16,
        4.44089210e-17])
While the fourth mean, , is certainly as good a zero as the book’s answer, it isn’t the same. To double-check my work, I ran this:
python:
>>> xs[:, 3].mean()
-1.3322676295501878e-16
This is the book’s value. What’s going on?
You may think this is perfectly normal. Floating point numbers are inherently inexact, and as long as I get a result that’s effectively zero, there’s nothing to be bothered about. But I was bothered.
I’m using the same function, mean, from the same library, NumPy, on the same set of data, and I get different answers depending on how I invoke that function. Or maybe I do get the same answers. Here’s another command and its output:
python:
>>> for i in range(xs.shape[1]):
...     print(f'Column {i}: {xs.mean(axis=0)[i] == xs[:, i].mean()}')
...
Column 0: True
Column 1: True
Column 2: True
Column 3: False
Column 4: False
For the first three columns, it doesn’t matter which way I use mean; for the last two, it does.
I should mention here that while the different results are obvious when the mean is close to zero, this behavior is present when operating on any 2D array. I’ve tried it out on several 2D arrays made from randomly generated floating point numbers.
During these experiments with randomly generated arrays, I got the sense that the likelihood of getting the same mean both ways got smaller as the number of rows in the array got larger. I decided to check that out with this script:
python:
 1:  #!/usr/bin/env python3
 2:
 3:  import numpy as np
 4:
 5:  rng = np.random.default_rng()
 6:
 7:  N = 5000
 8:
 9:  for n in (10, 100, 1000, 10_000, 100_000):
10:    count = 0
11:    for i in range(N):
12:      x0 = rng.uniform(low=0, high=100, size=n)
13:      x1 = rng.uniform(low=100, high=200, size=n)
14:      x = np.column_stack((x0, x1))
15:      if x.mean(axis=0)[0] == x[:, 0].mean():
16:        count += 1
17:      if x.mean(axis=0)[1] == x[:, 1].mean():
18:        count += 1
19:    print(f'n = {n:,d}')
20:    print(f'  Same means: {count/(2*N):.2%}')
The results were
n = 10
  Same means: 73.97%
n = 100
  Same means: 28.47%
n = 1,000
  Same means:  7.47%
n = 10,000
  Same means:  2.50%
n = 100,000
  Same means:  1.03%
So arrays with more rows are less likely to yield the same mean values when the mean function is used in these two different ways.
My working theory is that when I use mean() on a 1D array extracted from a 2D array, the computations are done differently than when I use mean(axis=0) on the 2D array. Mathematically the same, but computationally different. Maybe it’s as simple as the summation being done in a different order so the partial sums round off in slightly different ways. The more partial sums, the greater the likelihood of a different answer.
Ultimately, and are both zero, so this was mainly an exercise in satisfying my curiosity. I worry when computer results that ought to be exactly the same are only nearly the same. It usually means I’ve done something wrong, but apparently not in this case.
Update 9 Oct 2026 9:41 PM
Nathan Grigg, who has set me straight too many times to count, pointed out that the NumPy docs for sum explain how that function uses algorithms with different precision depending on
- whether the
axisparameter is used or not; and - which axis is chosen if the parameter is used.
There’s basically a speed/precision tradeoff at work. While it’s true that the docs for mean don’t include this explanation, sum and mean are so alike that it must be the reason for the different answers.
Thanks, Nathan!