Kayaking
August 12, 2025 at 9:08 PM by Dr. Drang
I was mentioned in the Snell Talk segment of yesterday’s episode of Upgrade. Jason was asked if he had a paddleboard, and he talked about how he’d like to have a kayak to go paddling in the bay near his home. The downside of owning a kayak is that you have to store and transport it, both of which can be a pain in the ass unless you have a foldup kayak. Like the Oru Inlet I have, which collapses down to the size of a large suitcase and fits neatly in the trunk of my RAV4.

As Jason said on the show, he’d probably need a kayak that’s a bit bigger and more stable than mine because of the choppier water he’d encounter in his bay. While I’ve been out on windy spring days when the waves were a foot high and had whitecaps—yes, even on the relatively small lakes around here—it’s unusual for me to see much chop.
The segment reminded me that I’ve been meaning to write about a place I really enjoy paddling. It isn’t a small lake, it’s a 75-mile long canal. The Hennepin Canal connects the Illinois River to the Mississippi, running from Bureau Junction (just north of Hennepin) on its east end to the Quad Cities on its west end. It was built between 1890 and 1907.
Two things may stand out from that brief description. First, why is anyone building a canal from the Illinois to the Mississippi? After all, the Illinois feeds into the Mississippi—albeit at the southern tip of the state, hundreds of miles away. And second, isn’t the turn of the 20th century too late to be building a canal? We had railroads by then. Both of these are good points and help explain why the canal was never a real success. It limped along with much less traffic than planned until it was shut down by the Corps of Engineers in 1951. Twenty years later, it was turned over to the State of Illinois for recreation.
And for that, I’m grateful. Although it takes me about two hours to get to it, I’ve had a lot of fun paddling both east and west along much of its length from Lock 21 near Wyanet to Lock 24 at Geneseo.
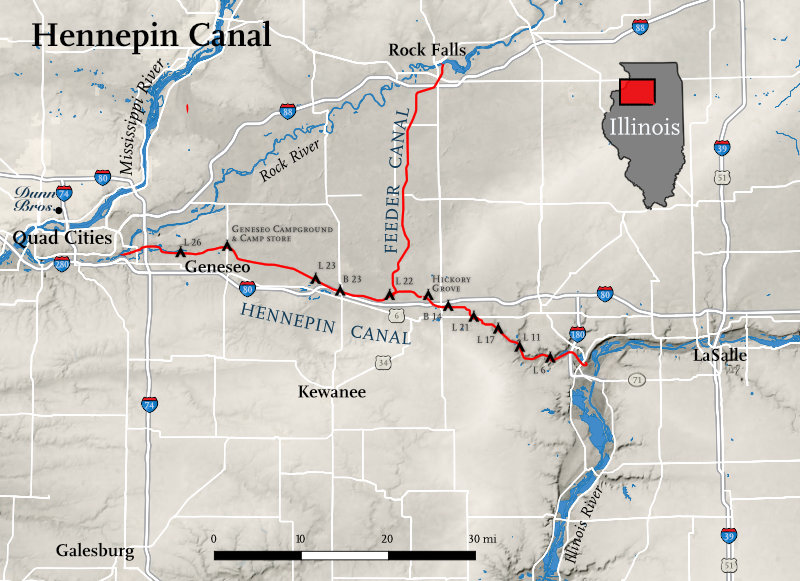
Map drawn by Steve Spindler.
I just went last Friday, paddling for about 2½ hours,
I saw only one other person, a woman biking on the towpath. Did I mention the towpath that runs along the canal has been turned into a bike path? I typically see more people along the canal than in it. And I’m the only kayaker/canoeist I’ve ever seen. Fishermen in boats using trolling motors are fairly common, but I’m an anomaly.
There are a few aqueducts on the canal, where you paddle on a water bridge over a stream that passes underneath. And although there are highway bridges that pass over the canal, the more common way to paddle under a roadway is to go through a culvert.
That was shot with a GoPro mounted on the bow. I didn’t have a GoPro the last time I went over an aqueduct, so I don’t have any movies of that. Next time.
I believe all the aqueducts are original. They carried barges over the streams a century ago just like they carry me. Most of the bridges and all of the culverts were built after the canal stopped having barge traffic.
The locks are numbered from east to west, and there are a crapload of them in the eastern portion of the canal because the land rises steeply out of the Illinois River valley. Here’s the canal’s profile:
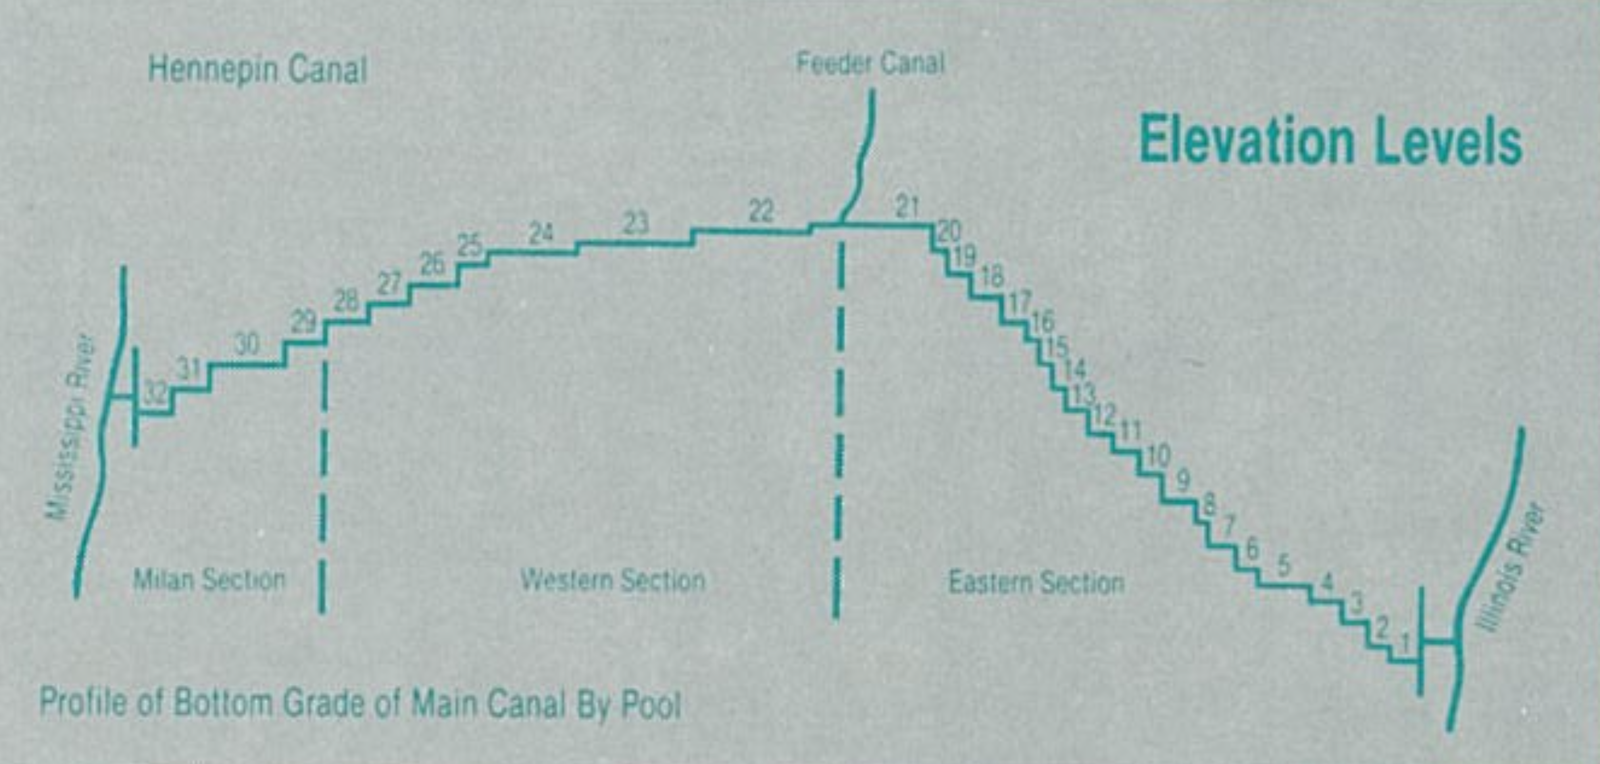
Now you can see why I paddle between Locks 21 and 24. There’s so little distance between the other locks, you can’t have a nice trip.
The locks themselves are fun to visit. All the ones I’ve seen have had little picnic areas nearby, and some have campgrounds. The locks don’t operate anymore, but you can still see a lot of the mechanisms and get a sense of the difference in water level between the sections. Here’s a view looking east along Lock 22; the water is a few feet higher on the other side of the far gate.

Because the canal is at its highest point between Locks 21 and 22, water has to come from somewhere to run west down to the Mississippi and east down to the Illinois. That’s the purpose of the feeder canal, which brings water down from the Rock River 29 miles to the north. It meets the main canal between Locks 21 and 22 at a place called Summit Pool. The locks insure that there isn’t much current in the main canal, but what little current there is runs west when you’re west of Summit Pool and runs east when you’re east of it.
Because I haven’t yet convinced my kayaking friends to take the long drive out to the Hennepin Canal, all of my trips on it have been of the there-and-back variety. I can’t go one way from lock to lock because I have to get back to the put-in place where my car is parked. I suppose I should look into whether there are any Uber or Lyft drivers out there.
Knowing what this world is about
August 9, 2025 at 3:59 PM by Dr. Drang
This Scientific American article (web | Apple News) about new hydrogel adhesives is interesting, but I have one small nit I need to pick with it.
Here’s the paragraph that brought me up short:
After synthesizing the ultrasticky gels, the scientists took two of them into the field to test their real-world capabilities. The researchers used one gel to seal a hole at the base of a three-meter-long pipe that was filled with tap water to simulate a high-pressure water leak. And they used the other to affix a rubber duck onto a rock to see how well the technology fared in seawater. One day these gels could help researchers develop artificial skin or repair underwater and offshore structures.
Emphasis added to the problem sentence. The pressure at the bottom of a three-meter pipe isn’t high, at least not by most standards. And it’s easy to calculate.
The pipe is oriented vertically and open to the atmosphere at its top. (If this weren’t the case, the length of the pipe wouldn’t matter—also, the video in the article briefly shows both a tall vertical tube and someone patching a hole near its base.) So the water pressure at the bottom, , is
where is the density of water, is the acceleration due to gravity, and is the height of the water column. Plugging in the values for all these, we get
where . Converting from pascals into US Customary units for people like me yields 4.27 psi.
Is this a high pressure? I wouldn’t say so. If my garden hose had a leak, a patch would have to withstand a pressure an order of magnitude higher than this, and most people wouldn’t characterize residential water pressure as particularly high.
This doesn’t mean the adhesive isn’t impressive—it certainly is. It’s the SciAm writer and editor I’m picking a nit with, not the researchers.
By the way, I knew the pressure at the bottom of the pipe was going to be less than 5 psi before doing any calculations. At some point in my life, I read an article—probably by Isaac Asimov—about how one of the early uses of steam engines was to power pumps to pull water out of mines. These were vacuum pumps installed at the surface, and it was soon learned that no matter how powerful the steam engine was, or how good the seals were in the valves and connections, water could not be pulled up more than about thirty feet. That’s because the pressure of a thirty-foot column of water was roughly equal to atmospheric pressure, which in turn is about 14.7 psi.
Since three meters is about one-third of thirty feet, the pressure at the bottom of the pipe was going to be something less than 5 psi. It’s funny how some things stick with you.
-
There’s also the question of whether the water pressure is the only thing that matters when it comes to sealing a leak. It isn’t. You also have to account for the area of the hole, the area of the patch that’s sticking to the pipe, and the strength of the hydrogel patch material itself. But here we’re only questioning the “high-pressure” part of the article. ↩
Beam deflections by the conjugate beam method
August 6, 2025 at 12:39 PM by Dr. Drang
As a companion piece to the post on the moment-area method, today we’ll go through another way to solve the differential equations of beam bending without doing any serious math. This is called the conjugate beam method, and it was developed by Harold Westergaard in this 1921 paper.
I want to start with a few facts about Westergaard. When he wrote the conjugate beam paper, he was in the Theoretical and Applied Mechanics department
The conjugate beam method is based on the similarity of two differential relationships. First is the relationship between bending moment, , and deflection, ,
which we explored in the moment-area post. Second is the static equilibrium relationship between the moment and the applied load, ,
(The terminology, assumptions, and sign conventions we’ll be using here are the same ones laid out in the moment-area post. I won’t repeat them.)
You can combine these two relationships into a single differential equation,
where we start using lowercase roman numerals instead of primes after the third derivative. Westergaard’s paper has this lovely figure showing the sequential integration that takes us from applied load to deflection:
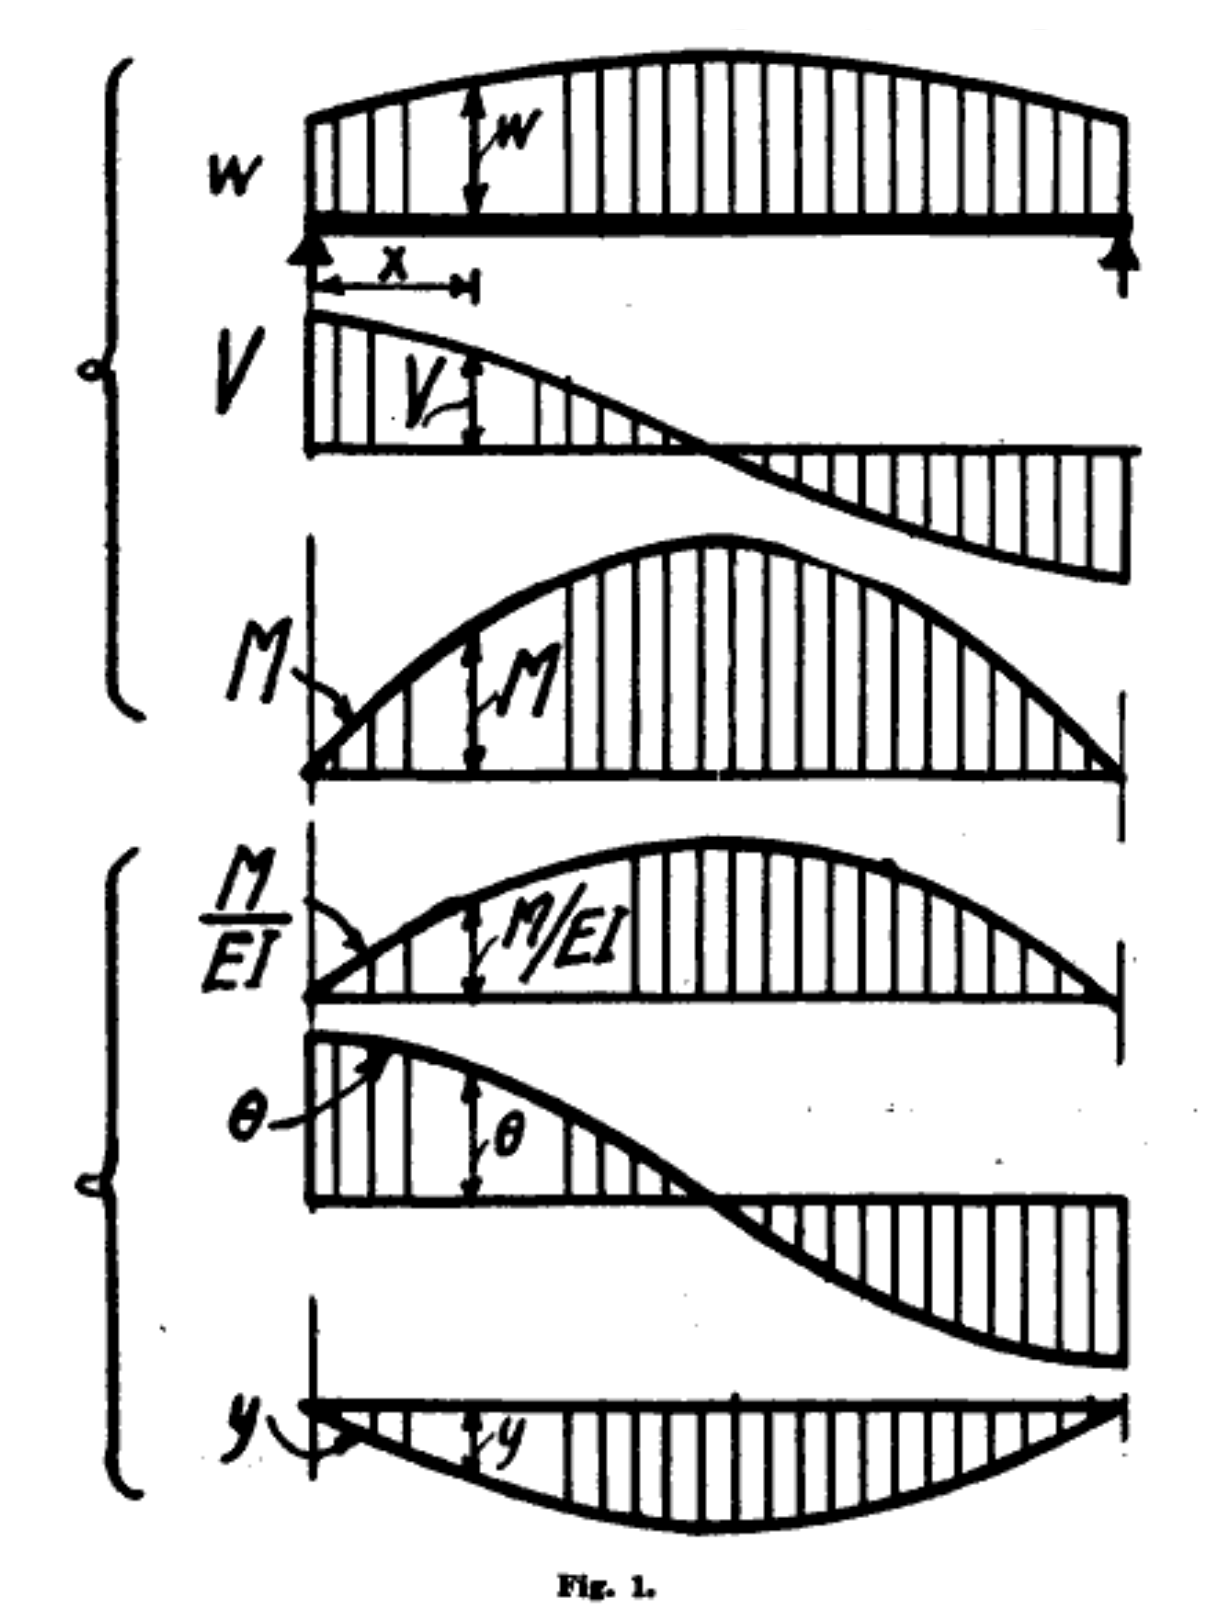
What makes this drawing so pleasing to me is the amateur quality of the lettering and the arrowheads. Westergaard was an assistant professor in 1921 and probably did the drawings himself instead of using a draftsman. And the Journal of the Western Society of Engineers didn’t mind.
Integrating the applied load (and flipping the sign) gets us the shear; integrating the shear gets us the moment; integrating the moment (after flipping the sign and dividing by ) gets us the rotation; and integrating the rotation gets us the deflection.
The upper three diagrams come from the static relationships
and the lower three come from
The parallels between these relationships and diagrams are what we exploit in the conjugate beam method. Imagine a beam that’s the same length as the real beam whose deflection we want to calculate. We apply to this imaginary beam a load that matches the moment of the real beam divided by . Then the shear in this imaginary beam will be the rotation in the real beam and the moment in the imaginary beam will be the deflection in the real beam.
As you might guess, we call this imaginary beam the conjugate of the real beam, and we have reduced the problem of determining rotations and deflections to that of determining shears and moments. And as we’ve discussed, the determination of shears and moments is second nature to structural engineers.
There is, however, one last little problem we haven’t considered yet. We know the conjugate beam has the same length as the real beam, but how is it supported? What are its boundary conditions? For that, we need to consider our real/conjugate analogy in more detail.
For a simple support at the end of a real beam, the moment is zero and the shear is nonzero. By analogy, that end of the conjugate beam will have zero deflection and nonzero rotation. Therefore, a simple support at the end of a real beam becomes a simple support at that same end of the conjugate beam. That’s convenient.
For a fixed end in a real beam, the moment and shear are both nonzero. By analogy, that end of the conjugate beam will have nonzero deflection and nonzero rotation. Therefore, a fixed end in a real beam becomes a free end in the conjugate beam.
You can probably work out the next one. For a free end in a real beam, the moment and shear are both zero. By analogy, that end of the conjugate beam will have zero deflection and zero moment. Therefore, a free end in a real beam becomes a fixed end in the conjugate beam.
What about interior supports? Or hinges in the middle of the real beam? No worries, Westergaard has us covered with another quaint little drawing:
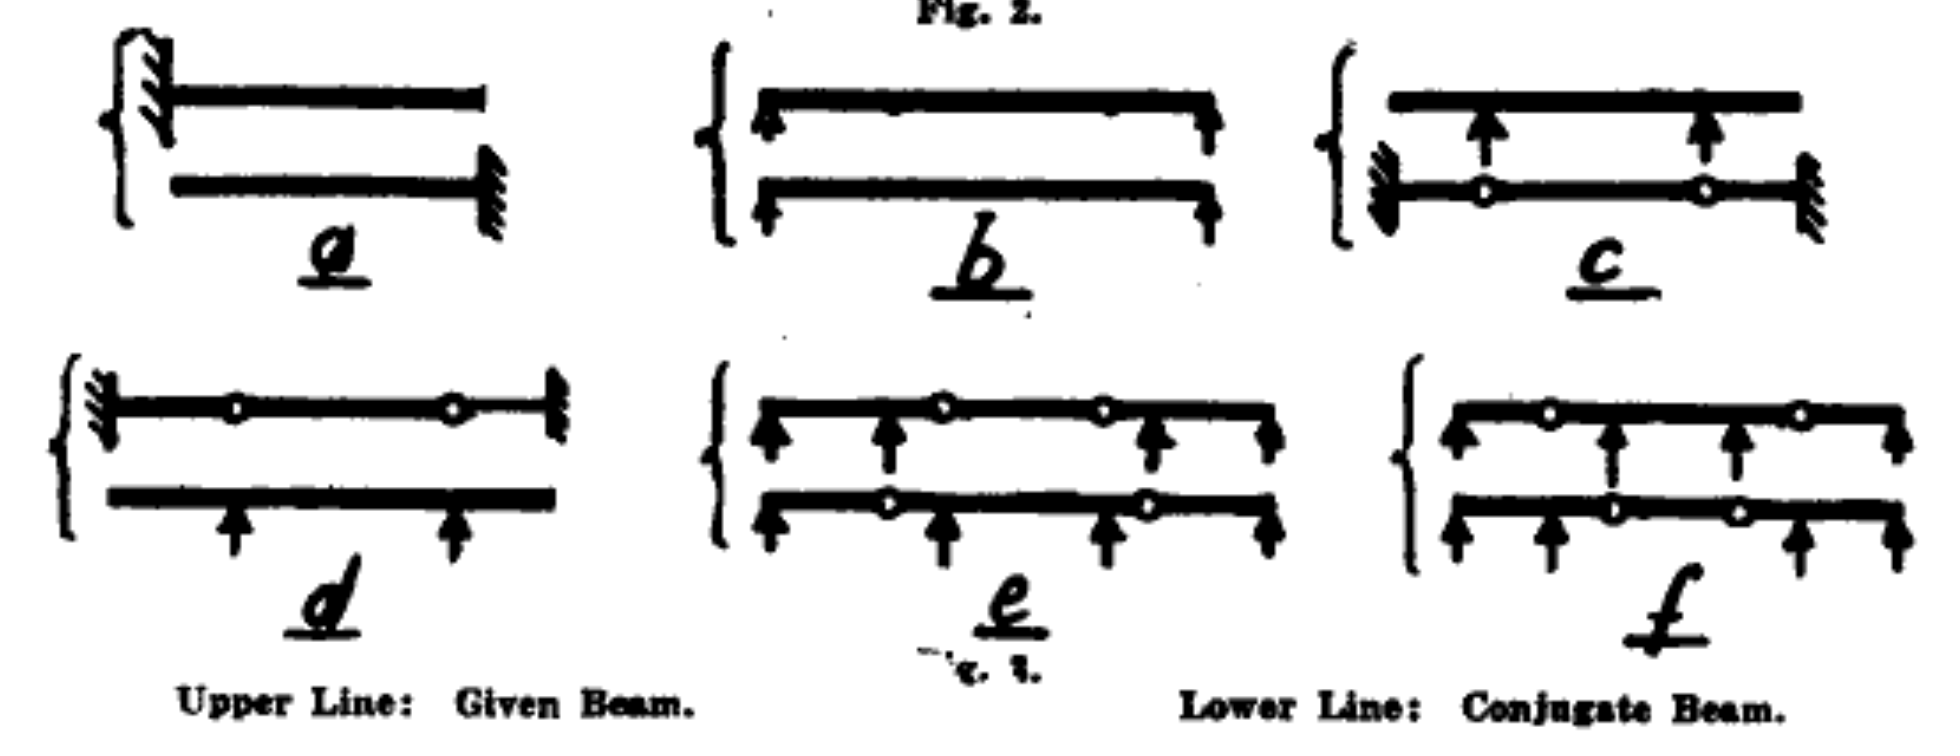
Basically, interior hinges turn into interior supports and vice versa. The same analogies get us to this because hinges have zero moment and supports have zero deflection.
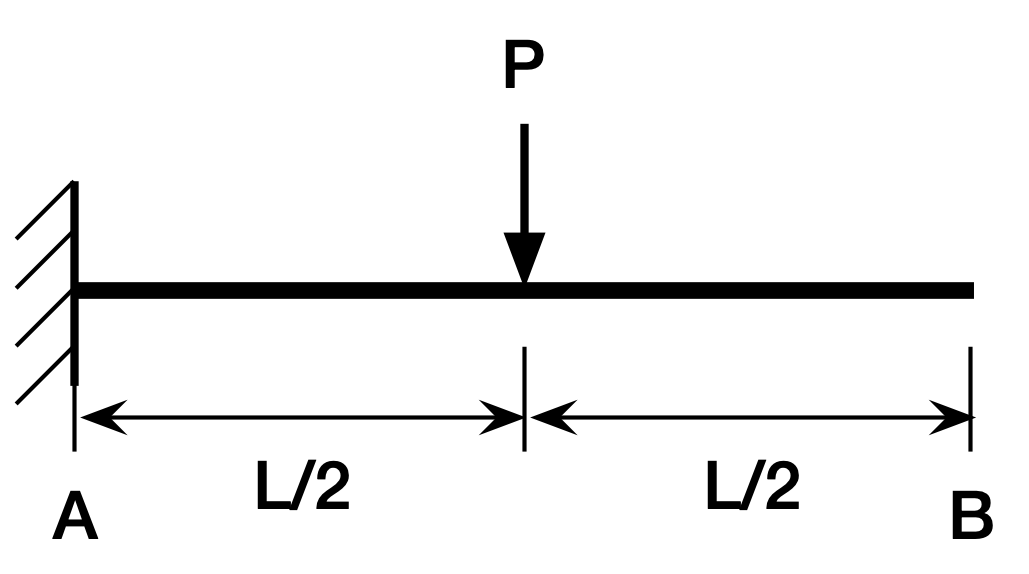
Now it’s time to use the conjugate beam method to calculate the tip deflection of our center-loaded cantilever beam. Here’s the beam,
and here’s its moment diagram,
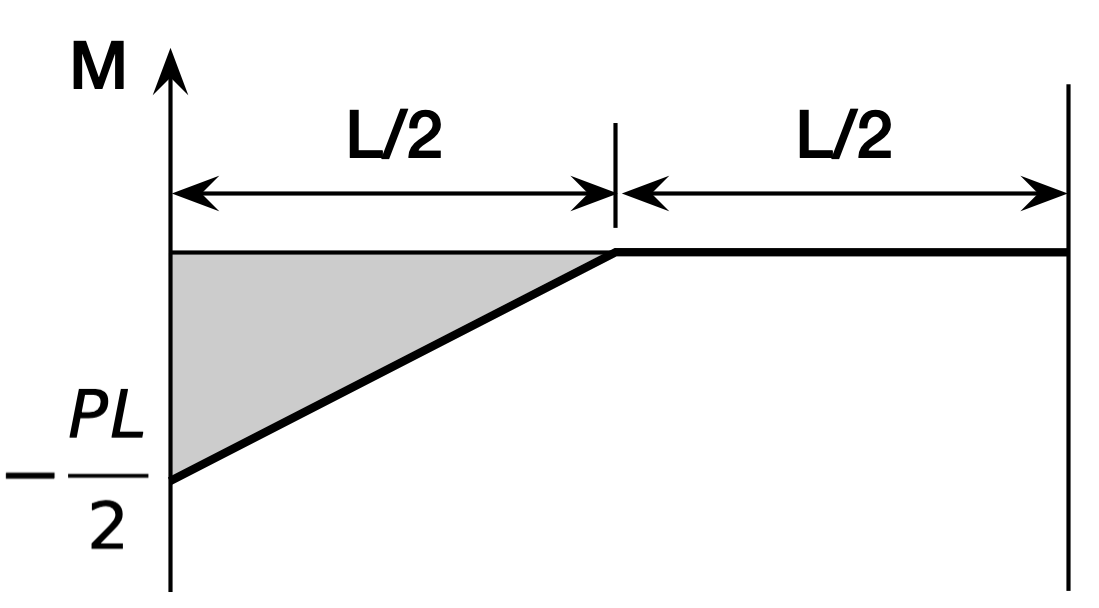
Using the rules above, we build the conjugate beam by turning the fixed end on the left into a free end and the free end on the right into a fixed end. Then we take the moment of the real beam and turn it into a distributed load on the conjugate:

The loads are going up on the conjugate beam because that’s the negative direction for loading. The resultant of the triangular load is
and its centroid is of in from the left end. That makes the moment at the right end of the conjugate beam
which is the deflection of the right end of the real beam. As with the moment-area method, the explanation of why it works takes a while, but the application is very quick.
-
The TAM department later merged with the Mechanical Engineering department to make the Mechanical Sciences & Engineering department, which my younger son graduated from a few years ago. ↩
Minor notebook update
August 5, 2025 at 9:53 PM by Dr. Drang
I started a new notebook last week and thought it worth writing another update on how I’m using it.

I’m still using Feela A5 notebooks because they hold up well and are cheap—as am I. I’m still using a Pentel Kerry mechanical pencil; that’s it tucked in the notebook’s loop. I’m still keeping my index of pages in an iCloud file called Notebook index.txt, and most of the index entries are still added through dictation via a Shortcut on my iPhone.
What’s new is that I’ve started keeping a to-do list in the notebook. I’m not busy enough to have a daily list, but a weekly list works well. Every Monday I write out two lists on a two-page spread: this week’s tasks on the left side and future tasks on the right:
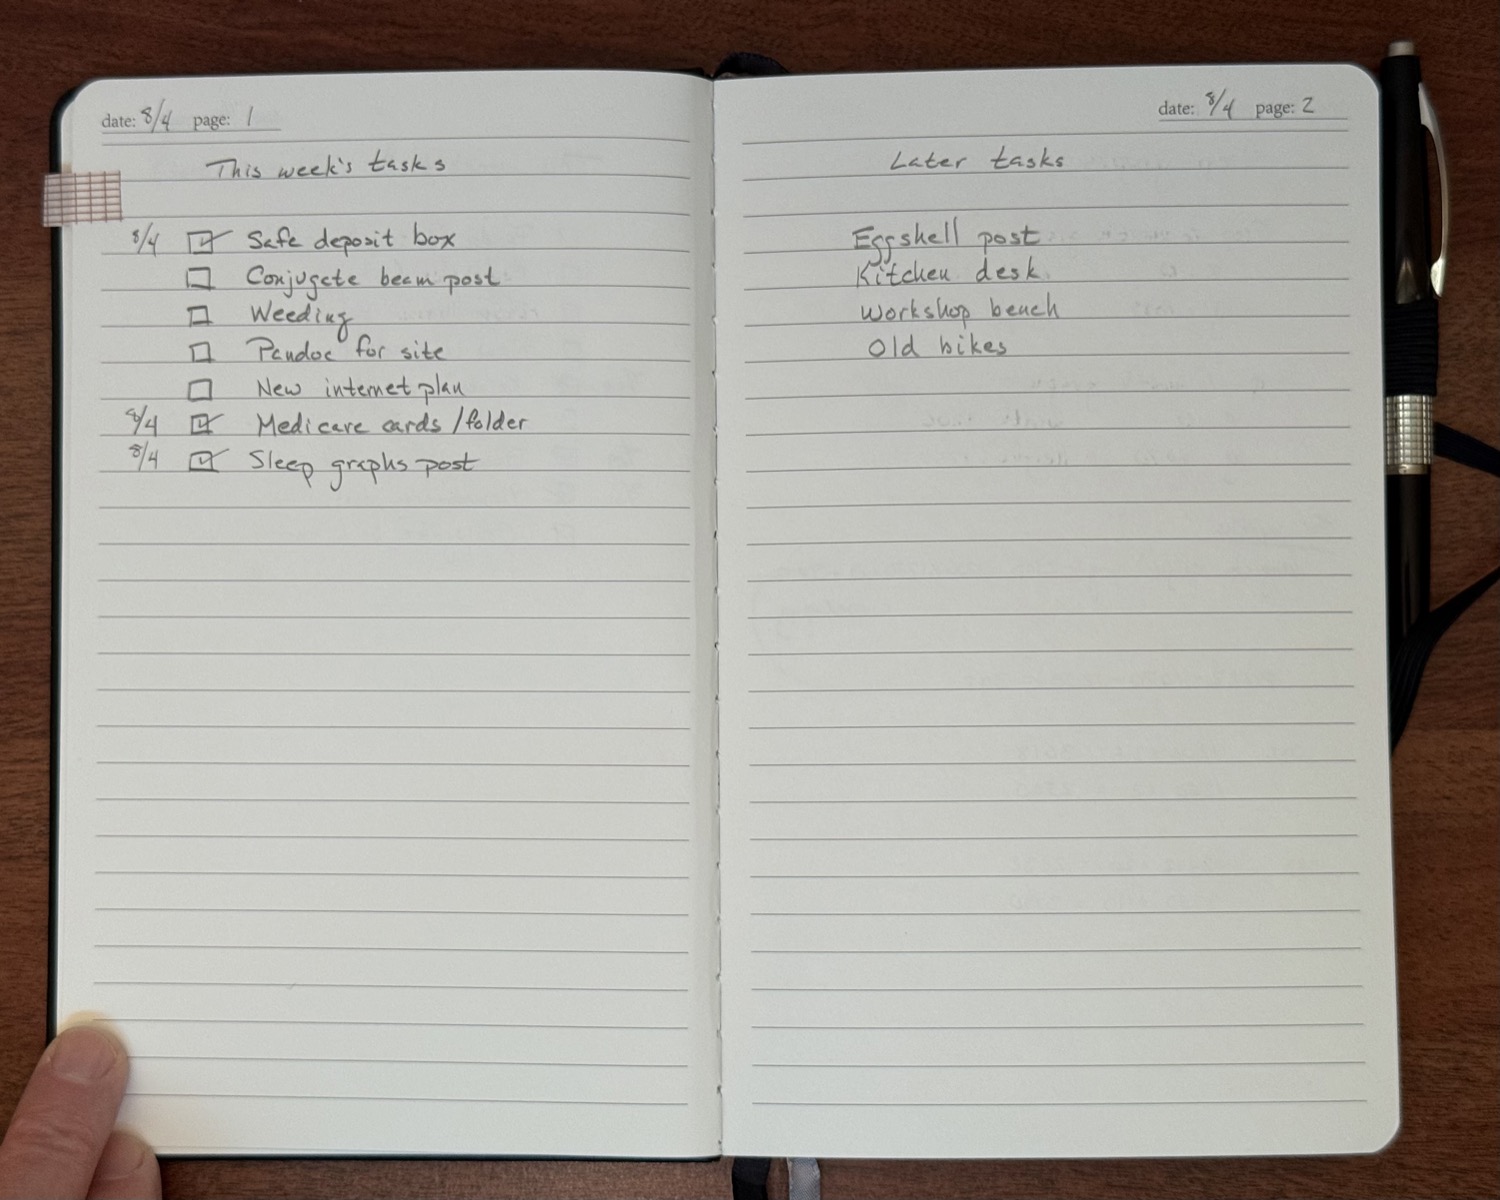
A few things I want to mention:
- I took the photos for this post this morning. I have since done the weeding that’s third on the list, and I added a task for writing this post. I add the date next to the checkbox when I complete a task. I know there are systems that suggest markings other than checkboxes. Too fussy for me.
- The future tasks on the right are not the sort of overarching life goals you often see productivity gurus suggest. I don’t need to write down goals like that. The tasks on the right-hand page are basically the same sorts of things that are on the left-hand page, although typically a little less detailed. The only real difference is that I don’t expect to do them this week. I still write them down because otherwise I’d forget them.
- I add washi tape to tab the weekly task page for quick access and slice off last week’s tag with an X-ACTO knife. Washi tape is one of those things notebook freaks like to use, and of course I learned about it from Brad Dowdy and Myke Hurley. Sometimes I print out images from my computer to put into the notebook; I now use washi tape instead of Scotch tape to stick them in place. Apparently washi tape is not too fussy for me.
My notebook index file currently covers 8 notebooks and has over 500 entries. I got those numbers via egrep. The entries for each new book start with a line like
Book: 2023-06-12 to 2023-09-24so I can count the number of books using
egrep -c '^Book:' 'Notebook index.txt'Each entry line starts with the date in yyyy-mm-dd format, so they’re counted using
egrep -c '^\d{4}-\d\d-\d\d' 'Notebook index.txt'I’ve been doing the one-notebook thing for about three years now. It’s one of the few productivity undertakings that I’ve stayed with for multiple years with no breaks.
