Vibrating strings, aliasing, and the iPhone
July 17, 2011 at 6:01 PM by Dr. Drang
You’ve seen this video on YouTube, right?
The guitarist, Kyle Jones, put his iPhone in the body of his guitar and recorded a video of the strings vibrating as he played. The patterns produced are interesting and fun to watch. As he says in the notes to the video,
[T]his effect is due to the rolling shutter, which is non-representative of how strings actually vibrate.
Surprisingly (OK, not surprisingly, but disappointingly), several commenters on YouTube and contributors to this Reddit thread are arguing that the strings really do take on the shapes shown in the video, that they are not an artifact of the recording process. The Dunning-Kruger effect rears its head again.
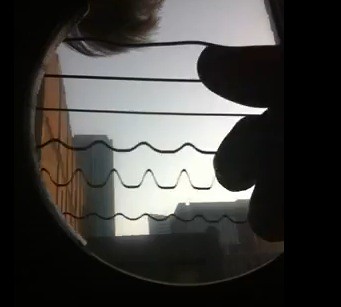
How can one refute the notion that the video shows the strings as they actually are (without solving the governing differential equation)? How about this screen grab of one of the “frames” of the video?

There’s no way the B string could take on that shape without the use of pliers.
As Mr. Jones says, the cool string shapes seen in the video are the result of what’s called the rolling shutter effect. We tend to think of videos as being like movies made on film, in which every frame represents the state of the subject at a particular instant in time. But some video cameras, typically those that use a CMOS sensor like the one in the iPhone, don’t record the entire scene at once. Instead, they record slices of the scene at slightly different times; the “frame” that results is actually a composite image formed from a set of slices.
If the objects in the scene are moving slowly relative to the timing of the slice exposures, the video that results is a realistic depiction of the scene. But if things are moving fast you get weird effects that don’t match reality.
This is a particular example of a more general phenomenon known as aliasing, a term that comes from the world of signal processing. When a continuous signal is sampled at discrete intervals, the sampled version can appear like another signal entirely. This graph (taken from the Wikipedia article) of two sine waves shows that the high frequency (red) wave sampled at relatively widely spaced intervals would look like the low frequency (blue) wave.

If you’ve ever taken a signal processing course, phrases like Nyquist frequency and Hamming window are probably popping into your head. Of course, if you’ve ever taken a signal processing course, you don’t need me to explain what’s going on in Jones’s video.
I’m not especially good at following through on blog post series,
where
- is the position along the string,
- is time,
- is the sideways displacement of the string, a function of both and ,
- is the tension in the string, and
- is the mass per unit length of the string.
There are two ways to solve this equation. The usual way, which fits well with the musical concepts of frequency and overtones, is through modal analysis. The other way is through a traveling wave analysis. I want to do both, but don’t hold your breath.
